


ECONOMIC OUTLOOK
Unemployment dropped to 3.6% in March 2022
Jobless Claims dropped to its lowest point since 1968, bringing the unemployment rate down to 3.6% at the end of March. The labor market saw 431,000 jobs added in that same month, as measured by nonfarm payrolls. Despite the U.S. economy adding at least 400,000 jobs per month since May of last year, the labor market continues to experience a shortage. There are still approximately 2.6 million less workers compared to the level of labor participation back in February 2020. This shortage appears to be further contributing to the rising inflation and prices. Many companies are beginning to raise wages to attract workers back to the workforce, as job openings continue to be near all-time highs. Average hourly wages have risen approximately 5.6% year-over-year, though this increase still lags the 8.5% increase in Consumer Price Index (CPI). Increased payroll costs are another increased cost for businesses, along with increased supply chain disruptions and raw materials costs, that are being passed through as increased prices to consumers for goods and services.
Inflation Continues to Rise
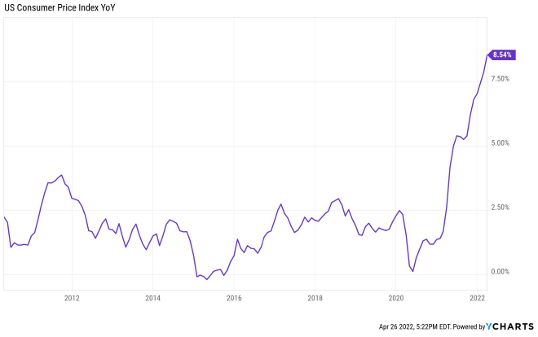
The CPI rose to 8.5% year-over-year this March 2022, up another 1.2% from the month prior. A large part of this increase has come from commodities, food, and energy. Energy prices alone rose by more than 10% in March, and gasoline prices more than 18% – undoubtedly impacted from the continued conflict in Ukraine. With inflation outpacing the increase in wage increases, families are experiencing a net decline in their real inflation-adjusted earnings. In the short-term families may be able to subsidize current spending levels by taking on more debt or dipping into existing savings, however it is likely to result in decreased spending in the intermediate to long-term if inflation does not begin to cool off.
Recent Yield Curve Inversion
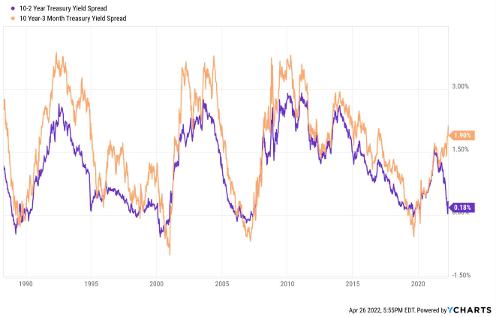
At the beginning of April 2022, the treasury yield curve inverted, as measured by the 10-year – 2-year Treasury yield spread. The 2-year Treasury yield rose just above that of the 10-year Treasury yield, resulting in the spread between the 10-year and 2-year yields being negative. The “inversion” of the yield curves, when the short-term rates rise above the longer-term rates, is often viewed as a precursor to economic recession. Thus, the recent inversion event has created some worries among investors that a recession may be looming around the corner. However, there are several nuances surrounding this recent inversion that investors should take note of before drawing recessionary conclusions. First, a look at prior recessions in the early 1990’s, early 2000’s, 2008, and most recently 2020 will highlight that both yield spreads had inverted prior to the start of the recessionary cycle. The 10-year – 3-month, however, remains very positive – with a spread of 1.86% when the 10-year – 2-year spread initially inverted on Friday, April 1st. Additionally, this recent inversion occurred on the heals of announcements from the Federal Reserve that they would be rising short-term borrowing rates steadily during 2022. This expectation of rate increases resulted in a sharp rise in short-term yields that pushed the 2-year Treasuries slightly above its 10-year counterpart. Further, the inversion did not last long – with the 10-year – 2-year spread returning positive the very next trading day on Monday, April 4th. This appears to indicate that the inversion was driven more because of short-term investor sentiment due to Fed announcements than of the future economic outlook for the U.S. economy. Lastly, prior recessions have notably seen more than one inversion prior to the start of the recessionary cycle, with a lag time ranging approximately 12 to 18 months. We have only experienced one very brief inversion here, so to experience a recession any time soon (before the next 12 to 18 months) seems to be unlikely.Certainly, there are a number of factors in addition to just inflation to consider, and there is no guarantee that the market will be positive in 2022 simply due to high levels of inflation, but it is one of many indicators for strong overall outlook for 2022, despite some of the recent short-term volatility.
MARKET UPDATE
Equity Valuations are beginning to subside, creating opportunities in Equity markets
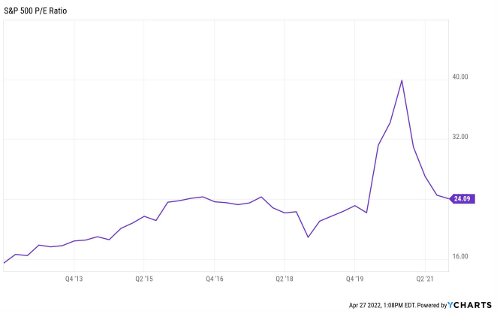
Several global and domestic equity market sectors have seen declines in valuations recently. The most recent quarterly S&P 500 P/E Ratio decreased to approximately 24.09, which is reverting closer towards its 10-year average of 22.49 (as measured by quarterly P/E ratio metrics). Corporate earnings over the past year grew substantially – outpacing the corresponding stock market returns, which further indicates equity valuations are beginning to decrease, especially due to earnings growth remaining one of the best predictors of long-term stock returns. Recent inflation concerns, interest rate hikes, and quantitative tightening have all contributed to wary investor sentiment in the equity markets as of late – leading to turbulence and pull back in major equity market performance to start 2022. However, the strong earnings growth and softening of equity valuations appears to indicate that there are some attractive opportunities for various equities compared to their pricing from a year ago, as well as certain market sectors, such as Small Cap stocks, with discounted equities that are priced below their historical 10-year average valuations.
Market Volatility Continues in 2022
The market is ending April on turbulent note, with the Dow Jones Industrial Average (DJIA) shedding nearly 2,200 points from April 21st through April 26th. This volatility comes on the heels of the Federal Reserve chairman alluding to a potential 50 basis point hike in the short-term borrowing rates in early May, with another increase coming again in June. However, this short-term sentiment and the fears of recession appear to be exaggerated when you look at the underlying economic data and circumstances behind the yield curve inversion. Investors have grown accustomed to this extremely low interest rate environment, and it’s important to note that even with these projected rate hikes we are still in a very loose monetary policy environment when looking at the overall M2 money supply. As of now, this short-term volatility does not seem to outweigh the longer-term indicators that economic and market conditions will finish strong for 2022.
Interest Rate Updates from the Federal Open Market Committee
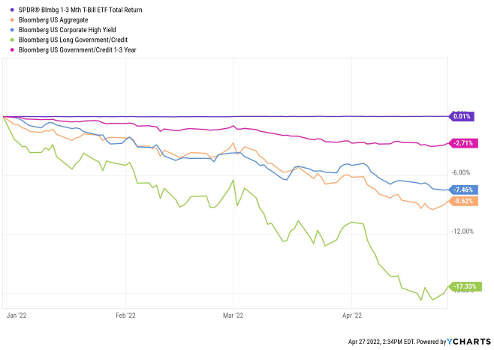
The recent Federal Open Market Committee (FOMC) meeting on March 15th and 16th concluded with the federal funds rate target range being raised by 25 basis points, with indications that it could raise rates seven to eight times this year. Not surprisingly, this resulted in sharp increases in the short-term treasury yields, especially the 2-year Treasury that edged above the 10-year yield at the beginning of April resulting in a brief inversion of the 10-year – 2-year yield curve. This uncertainty over the extent to which the Fed will raise rates, and how quickly, has resulted in a great deal of turbulence in Corporate Bond and High-Yield Bond sectors and substantial downward pressure on prices. Bond sectors faring the most favorable during this current rising rate environment has been short-term Treasury Bills (i.e. 1-3 Month T-Bills) and short-term to intermediate-term Government Bonds.
SMARTER WAY TAKEAWAYS
Economic Outlook
With inflation and consumer staples such as energy, groceries, and gasoline dramatically outpacing the rise in wages, consumer spending could begin to cool off the economic growth we’ve seen over the past year. However, the Federal Reserve appears to be committed to combatting the inflation problem with both short-term interest rate increases, as well as further quantitative tightening. Further, corporate earnings continuing to be strong among many sectors, and recent economic growth has been enough to continue driving increased job creation, which significantly more room still for further job growth. If the Fed policies can manage to cool down inflation without creating too much restriction on the economy, the outlook for growth is positive.
Market Outlook
Although market volatility has ramped up recently to close out April, the strong corporate earnings growth and softening of equity valuations coupled with some encouraging positive economic indicators appear to signal that the market outlook for 2022 remains positive. The recent pullback seems to be largely driven by short-term investor reactions to some of the recent Fed policy announcements and some speculation of a recession due to the recent inversion of the 10-year – 2-year yield curve. However, as mentioned above, the circumstances surrounding the inversion are significantly different than prior instances that preceded recessionary cycles. As of now, we remain consistent with our initial perspective at the start of the year that we would experience increased volatility and turbulence throughout 2022 comparative to recent years.
Smarter Way Models & Allocations
Our outlook for the economy and market both remain optimistic for 2022. However, we are continuing to monitor the volatility amidst the rising inflation and interest rate environment. We are continuing to remain invested in equity markets, however only at 50% of the maximum exposure as both of our market signals remain negative. Our Fixed income models remain in Intermediate Government Bond exposure as the turbulent interest rate environment has continued to put downward pressure on corporate and high yield bond prices. However, as even certain Government Bond sectors such as Long-Term Government Bonds have experienced significant volatility, we have replaced 50% of our Diversified Fixed Income model with 1-3 Month T-Bills exposure significantly reducing the downside movement bonds have seen recently.
OUR MARKET SIGNALS
Alpha/Omega (Equity Market Indicators)
Alpha and Omega are a pair of equity market trend indicator algorithms managed by our Team. Alpha is a short-term indicator that tends to be more active, while Omega indicates longer-term trends and is less active. We use these trend indicators to provide input for our Large, Mid and Small Cap equity models; as well as our Dynamic and 401(k) Allocations.
Both Alpha and Omega are negative, resulting in only 50% of the maximum equity exposure in our Dynamic Growth Allocations.
Gamma (Equity Market Growth vs. Value Indicator)
Gamma is our third equity market trend indicator algorithm managed by our Team at A Smarter Way to Invest that identifies and measures key market metrics, which indicates whether Growth sector versus Value sector equities are poised to outperform the other in the future. We use this trend indicator to provide input for our Large, Mid and Small Cap models.
Gamma currently indicates Value is more favorable, resulting in a heavier weighting in Value Equities in our Large, Mid and Small Cap models.
